As cybersecurity reverse engineers, our daily battle against malicious software demands an ever-evolving toolkit. While traditional static and dynamic analysis remain crucial for in-depth understanding of individual malware samples, the sheer volume and escalating sophistication of modern malware necessitate more scalable and automated approaches. This is where data science and machine learning enter the arena, providing powerful techniques to build automated detectors and analyze vast datasets of malware.
This guide delves into two critical data science techniques: Malware Network Analysis and Shared Code Detection. These methodologies are indispensable for moving beyond isolated sample analysis, enabling us to identify broader threat campaigns, discover malware families, and understand the intricate relationships between seemingly disparate malicious artifacts. By systematically uncovering these connections, we transform raw data into actionable threat intelligence, empowering more effective and proactive defenses.
The Landscape: Why Connect the Dots?
The traditional approach to malware detection, heavily reliant on signatures (specific byte patterns), struggles against modern adversaries. Malware authors constantly employ sophisticated packing and obfuscation techniques to superficially alter their code while retaining malicious functionality, rendering static signatures ineffective. This creates an unending “arms race of hiding versus detecting.”
Here’s why connecting malware samples through network analysis and shared code detection is critical:
- Beyond Individual Samples: Shift from analyzing one sample at a time to understanding the broader ecosystem of threats.
- Automated Threat Intelligence: Systematically reveal adversarial attack campaigns, common malware tactics, and the origins of malware samples. This helps differentiate between isolated incidents and coordinated campaigns.
- Accelerated Analysis: Rapidly identify previously analyzed samples similar to a new threat, significantly reducing analysis time by leveraging existing knowledge.
- Family & Toolkit Identification: Determine if different samples originated from the same malware toolkit, were crafted by the same threat actor, or belong to an existing malware family, even if superficially different.
I. Malware Network Analysis: Mapping the Threat Landscape
Malware network analysis transforms raw malware datasets into invaluable threat intelligence by revealing adversarial attack campaigns and common tactics. It’s about seeing the forest, not just the trees.
A. Core Concepts: Nodes and Edges
At its heart, network analysis represents relationships.
- Nodes (Vertices): In malware networks, each individual malware file can be represented as a node. Alternatively, both malware samples and their associated attributes (like callback IP addresses, domain names, or even specific compiler versions) can be treated as distinct nodes. Nodes can also carry their own attributes, such as the file size of the malware or its initial detection date.
- Edges (Links): Relationships of interest define the edges connecting the nodes. These relationships could be shared code, identical network behavior, or common C2 infrastructure. Edges can also possess attributes, such as a “weight” indicating the strength or frequency of a connection.
B. Types of Malware Networks
Understanding different network structures helps in visualizing and analyzing relationships:
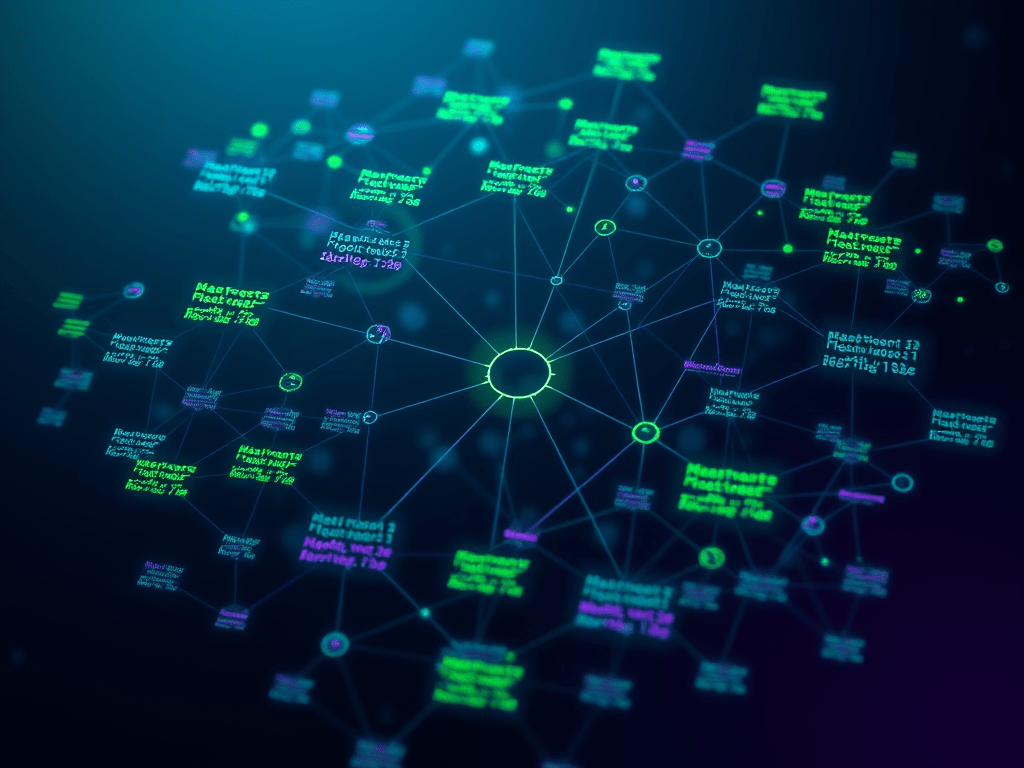
- Bipartite Networks: These networks feature nodes divided into two distinct partitions, with connections only existing between nodes from different partitions. In malware analysis, this often means one partition contains malware samples and the other contains shared attributes (e.g., callback domain names, PDB paths, or unique mutexes). This visualization can powerfully reveal that samples connected to the same attribute (e.g., communicating with the same C2 server) might originate from the same attacker or campaign.
- Visualizing Insight: Imagine a bipartite network where one column is malware hashes and the other is unique C2 domains. A neon blue line connects a malware hash to any C2 domains it communicates with. If multiple malware hashes connect to the same C2 domain, they likely belong to the same campaign.
- Bipartite Network Projections: To simplify a bipartite network and focus specifically on malware sample similarity, you can create a projection. This process links nodes in one partition (e.g., malware samples) if they share nodes in the other partition (e.g., common callback domain names). These projections can visually reveal large groupings or “social networks” of malware samples that correspond to different attack campaigns or families. A classic example is the analysis of the Chinese APT1 dataset, where shared callback servers revealed two major clusters representing distinct campaigns.
- Simplified View: After projection, you’d see malware hashes connected directly to other malware hashes if they share common C2s, without explicitly showing the C2 nodes. This provides a direct “similarity” map.
C. Visualizing Malware Networks
Network visualization is crucial for making sense of complex relationships and communicating insights.
- Force-Directed Algorithms: These algorithms arrange network nodes in a way that simulates “springs” pushing and pulling, aiming to achieve uniform length between connected nodes and to separate unconnected ones. This often results in visually appealing layouts where clusters of related malware are naturally grouped.
- GraphViz Tools:
fdp: Works well for smaller networks (typically fewer than 500 nodes).sfdp: Scales better for larger networks by merging nodes into “supernodes” based on proximity, though its layouts can sometimes be less clear for very precise analysis.
- GraphViz Tools:
- Key Tools for Building & Visualizing:
- Python’s NetworkX library: A de facto standard for network processing, allowing you to create, manipulate, and analyze graph structures programmatically.
- GraphViz toolkit: Used for generating high-quality graph visualizations from various input formats.
- Custom Scripts: Tools are often built to extract data like callback domain names or shared graphical assets from malware files (often from sandbox reports or static analysis) and then build bipartite networks and their projections for analysis.
II. Shared Code Detection: Quantifying Intimacy Among Threats
Shared code analysis, also known as similarity analysis, involves estimating the percentage of pre-compilation source code two malware samples share. This directly addresses the “arms race” by looking beyond superficial changes to core code commonalities. It dramatically improves malware analysis workflows by identifying previously analyzed samples, allowing analysts to reuse existing knowledge. It can also precisely determine if different samples were generated from the same malware toolkit or written by the same attackers.
A. Feature Extraction for Similarity
To compare malware samples, specific “features” are extracted from the binaries. These features are any malware attribute considered useful for estimating code similarity.
- Printable Strings: Contiguous printable character sequences extracted from binaries. This method is often robust against compiler variations because format strings defined by programmers tend to remain identical across minor recompilations.
- Dynamic Run Logs: For packed or polymorphic malware, features derived from dynamic run logs from a sandbox are invaluable, as running the malware can reveal its unpacked code and true behaviors.
- N-grams: To incorporate sequential information (e.g., the order of API calls or assembly instructions), the “bag of features” model can be extended using N-grams, which are subsequences of events of a defined length.
- Instruction Sequences: Comparing sequences of x86 assembly instructions, typically after disassembling the malware. This requires careful handling for packed or obfuscated samples unless they are first unpacked.
- Dynamic API Calls: Running malware in a sandbox, recording the sequence of API calls, and then extracting N-grams of these calls to compare behavioral patterns.
- Import Address Table (IAT): Comparing the DLL imports declared by malware binaries. This can be surprisingly effective even if other obfuscation techniques are used, as import declarations may remain consistent.
B. Quantifying Similarity: The Jaccard Index
The Jaccard Index is a widely adopted, simple, and intuitive function to measure the degree of similarity between two sets of features.
- Formula: For two sets A and B, the Jaccard Index is defined as the size of their intersection divided by the size of their union: J(A,B)=∣A∪B∣∣A∩B∣
- Interpretation: It yields a normalized value between 0 (no code sharing) and 1 (100% shared code). A value closer to 1 indicates higher similarity.
- Example (Conceptual):
- Malware A’s unique strings: {“create_file”, “write_reg”, “http_post”, “delete_self”}
- Malware B’s unique strings: {“create_file”, “http_post”, “download_url”, “inject_process”}
- Intersection (shared strings): {“create_file”, “http_post”} (size = 2)
- Union (all unique strings): {“create_file”, “write_reg”, “http_post”, “delete_self”, “download_url”, “inject_process”} (size = 6)
- Jaccard Index: 2/6approx0.33 (indicating some, but not extensive, overlap)
- Example (Conceptual):
C. Evaluating Methods: Similarity Matrices
A similarity matrix visually compares all pairs of malware samples within a dataset.
- Visualization: Each entry in the matrix represents a similarity value (e.g., as a shaded pixel, where white could be high similarity and black low).
- Insight: Ideal matrices for family detection show clear diagonal “white squares” or clusters for samples within the same family, indicating high internal similarity and distinctness from other families.
D. Scaling Comparisons: Minhash
For large datasets, where comparing every pair of malware samples results in a computationally prohibitive quadratic increase in time, Minhash provides an elegant solution.
- Concept: Minhash efficiently estimates the Jaccard Index between sets without needing to compare all elements. It reduces a set of malware features to a fixed-size array of integers (a “signature” or “sketch”) by using multiple hash functions and retaining minimum hash values.
- Efficiency: This allows for fast, approximate estimation of the Jaccard Index between samples by simply comparing their Minhash signatures, making large-scale similarity comparisons computationally tractable.
- Practicality: Python tools can readily implement search systems that leverage Minhash for rapid similarity lookups across vast malware repositories.
The Synergy of Static & Dynamic Analysis with Data Science
Both static and dynamic analysis are foundational, providing the rich raw data that fuels data science pipelines for sophisticated malware detection:
- Static Analysis: Involves inspecting a program file’s disassembled code, graphical images, printable strings, and other on-disk resources without running it.
- Outputs for Data Science: This yields crucial features like PE header information, Import Address Table (IAT) details, and embedded printable strings. Tools like pefile can dissect PE files to extract these.
- Limitations: Static analysis can be thwarted by sophisticated anti-analysis techniques like packing and obfuscation, which alter the on-disk binary to hide its true nature.
- Dynamic Analysis: Involves running malware in a safe, contained environment (a sandbox) to observe its real-time behavior.
- Outputs for Data Science: Provides invaluable runtime features such as file system modifications, network activity, API calls, and the loading of device drivers. Platforms like Cuckoo Sandbox (open-source) or commercial solutions provide detailed dynamic analysis reports.
- Benefits: Crucially helps bypass packing and obfuscation by allowing the malware to unpack itself and reveal its true behavior at runtime.
- Limitations: Malware authors often implement checks to detect and avoid execution in virtualized or sandbox environments. Furthermore, analyzing large numbers of samples dynamically for machine learning can be challenging due to time and resource constraints if not using dedicated, scaled platforms.
Ultimately, professional malware analysts meticulously combine both static and dynamic analysis for the most comprehensive and accurate results. The rich data generated from both approaches forms the bedrock for training robust machine learning systems and building insightful malware networks.
Actionable Guide: Your Lab Work in Malware Network & Shared Code Analysis
Ready to get hands-on? These actionable steps will guide you through building your own malware analysis capabilities, keeping in mind your black background, white text, and neon blue images theme.
Setting Up Your Environment (Neon Blue Console Vibes)
- Isolated Lab Environment:
- VMware Workstation/VirtualBox: Install a virtualization platform.
- Windows VM (e.g., Windows 7/10 for analysis): This will be your analysis machine. Configure it with internet access only through a proxy/VPN if you intend to detonate live malware, or keep it entirely isolated for safer static analysis.
- Linux VM (e.g., Ubuntu/Kali Linux): Your control machine for running Python scripts, data science tools, and potentially hosting Cuckoo Sandbox.
- Snapshotting: Crucial! Always take snapshots before doing anything potentially destructive.
- Essential Tools (Your Cyber Toolbox – Neon Blue Icons):
- Python 3: The core language for data science.
- Virtual Environments: Use
venvorcondato manage project dependencies (python3 -m venv malware_env). - NetworkX:
pip install networkx(for network processing). - GraphViz: Install the system package (e.g.,
sudo apt-get install graphvizon Linux) and the Python wrapper (pip install pygraphvizorpip install pydot). - scikit-learn:
pip install scikit-learn(for Jaccard, Minhash if custom implemented). - pandas:
pip install pandas(for data manipulation). - matplotlib & seaborn:
pip install matplotlib seaborn(for visualization). datasketchlibrary:pip install datasketch(for an efficient Minhash implementation).pefile:pip install pefile(for parsing Windows PE files).python-magic(optional):pip install python-magic(for file type identification).- Hex Editor: HxD (Windows), Bless (Linux), or 010 Editor (cross-platform, commercial but powerful).
- Disassembler: IDA Pro Free, Ghidra, or Radare2 (R2).
- Sandbox (Local): Cuckoo Sandbox is highly recommended for dynamic analysis data collection. Follow their comprehensive setup guide.
Lab 1: Building a Simple Malware Network (Shared C2 Domains)
Objective: Identify malware samples that communicate with the same Command and Control (C2) domains, suggesting a shared campaign.
- Data Collection (Dynamic Analysis):
- Acquire Samples: Obtain a small dataset of diverse malware samples. Use a safe, isolated lab environment for this! Publicly available malware samples (e.g., from MalwareBazaar, VirusTotal, or your own honeypots) are good starting points.
- Sandbox Execution: Submit each sample to your Cuckoo Sandbox.
- Extract C2s: From the Cuckoo reports, parse and extract all unique network communication domains (e.g., HTTP requests, DNS lookups).
- Data Preparation (Python & Pandas):
- Create a CSV or JSON file where each row is a malware sample and one column lists all extracted C2 domains (as a comma-separated string or list).
- Load this data into a pandas DataFrame.
- Building the Bipartite Network (NetworkX):
- Initialize an empty
networkx.Graph(). - Iterate through your DataFrame:
- For each malware sample (Node Type 1), add it to the graph.
- For each C2 domain associated with that sample (Node Type 2), add it to the graph.
- Add an edge between the malware sample node and each C2 domain node.
- Initialize an empty
- Visualizing the Network (Matplotlib/GraphViz):
- Use
matplotlib.pyplotandnetworkx.draw()for quick visualization of smaller graphs. - For more professional layouts and larger graphs, use
pygraphvizorpydotwith GraphViz’s layout engines (e.g.,dot,neato,fdp). - Visual Flair: Use neon blue for nodes (malware/C2s) and white for edges. Make malware nodes a different shape (e.g., circle) than C2 nodes (e.g., square). Clusters of malware connected to the same C2s should become visually apparent.
- Use
Lab 2: Shared Code Detection (String-Based Similarity with Jaccard Index & Minhash)
Objective: Identify malware samples with significant shared printable strings, indicating potential code reuse or family membership.
- Data Collection (Static Analysis):
- Acquire Samples: Use the same malware samples as Lab 1, or a new set focusing on different malware families.
- Extract Printable Strings: For each
.exeor.dllfile, usestrings(from Sysinternals on Windows orstringscommand on Linux) to extract all printable ASCII and Unicode strings. Store these as lists or sets of strings per sample.- Tip: Filter out very common strings (e.g., “This program cannot be run in DOS mode.”) that provide no unique value.
- Calculating Jaccard Similarity (Python):
- Write a Python function to calculate the Jaccard Index between two sets of strings.Python
def jaccard_similarity(set1, set2): intersection = len(set1.intersection(set2)) union = len(set1.union(set2)) return intersection / union if union != 0 else 0 - Create a nested loop to calculate the Jaccard similarity for every pair of malware samples.
- Write a Python function to calculate the Jaccard Index between two sets of strings.Python
- Scaling with Minhash (Datasketch Library):
- Shingling: Convert your list of strings for each malware sample into a set of “shingles” (e.g., hash each unique string).
- Minhash Signatures: For each sample, create a
MinHashobject from thedatasketchlibrary. Update it with the hashed shingles. Pythonfrom datasketch import MinHash # Example for one malware sample strings_for_sample_A = ["string1", "string2", "string3"] m_A = MinHash(num_perm=128) # num_perm = number of permutations (hashes) for s in strings_for_sample_A: m_A.update(s.encode('utf8')) # Must be bytes - Estimate Similarity: Now, you can quickly estimate Jaccard similarity between two MinHash objects:
m_A.jaccard(m_B). Compare these results to your direct Jaccard calculations for smaller datasets to see the accuracy.
- Visualizing Similarity (Similarity Matrix with Matplotlib):
- Store your pairwise Jaccard (or Minhash Jaccard) values in a NumPy array.
- Use
seaborn.heatmap()to visualize this similarity matrix. - Visual Flair: Use a diverging color map where white/neon blue indicates high similarity and black indicates low similarity. Group samples by known or suspected families to see the “white squares” of similarity emerge.
Lab 3: Exploring PE Header Features & Clustering (Advanced)
Objective: Use structural features from PE files to cluster malware samples, identifying groups based on compiler, linker, or packing characteristics.
- Feature Extraction (Pefile):
- For each Windows PE malware sample, use
pefileto parse its headers. - Extract numerical features: e.g.,
ImageBase,SizeOfImage, section entropy, number of sections, characteristics flags, compiler timestamp (if reliable). - Challenge: Normalize features (e.g., Min-Max scaling) so that larger values don’t dominate.
- For each Windows PE malware sample, use
- Clustering (scikit-learn):
- Use clustering algorithms like K-Means or DBSCAN from
scikit-learnon your extracted features. - Experiment with different
kvalues for K-Means or parameters for DBSCAN.
- Use clustering algorithms like K-Means or DBSCAN from
- Evaluation & Visualization:
- Evaluate cluster quality. Can you see known malware families grouping together?
- Use dimensionality reduction techniques like PCA (Principal Component Analysis) or t-SNE (t-Distributed Stochastic Neighbor Embedding) to reduce your high-dimensional feature vectors to 2D or 3D for visualization with
matplotlib.pyplot. - Visual Flair: Plot each sample as a point, colored by its assigned cluster. Use neon blue, white, and other contrasting colors for different clusters.
Conclusion: Your Evolving Toolkit
By integrating Malware Network Analysis and Shared Code Detection into your reverse engineering workflow, you transform from a forensic analyst of single samples to a strategic intelligence gatherer. These data-driven techniques, coupled with your foundational static and dynamic analysis skills, empower you to:
- Scale your analysis: Tackle the ever-increasing volume of malware.
- Anticipate threats: Identify emerging campaigns and actor tactics.
- Streamline investigations: Quickly relate new threats to known malicious families.
Remember, malware analysis is both a science and an art. The “art” part involves intuition and creative tool usage, but the “science” part is increasingly and powerfully driven by data. Embrace these methodologies, experiment with the tools, and continuously refine your approach. Your ability to connect the dots in the vast threat landscape will be your greatest asset in defending the digital frontier.
